


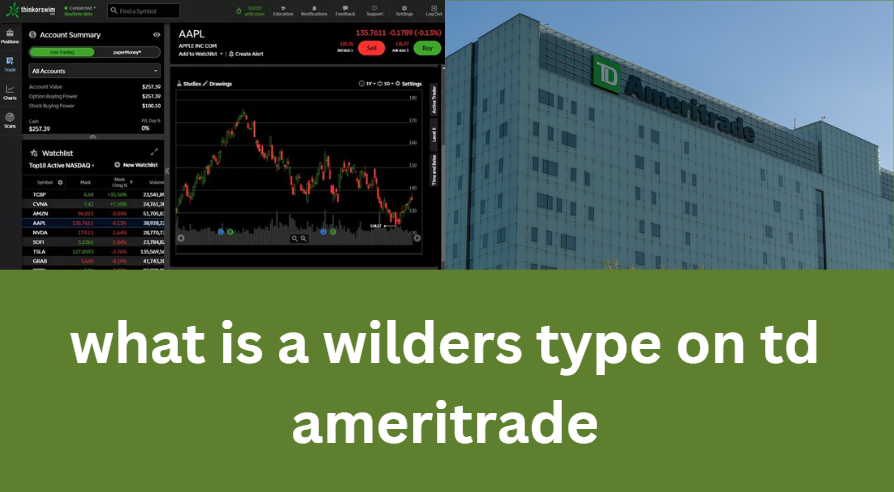
In the world of technical analysis, various types of moving averages are used by traders to analyze stock market trends, manage risk, and develop strategies. One such moving average, particularly familiar to users of TD Ameritrade, is the Wilder’s Moving Average. If you’ve ever wondered “what is a Wilder’s type on TD Ameritrade?”, this article provides a comprehensive explanation of what it is, how it works, and why it can be valuable in your trading strategy.
Contents
- 1 Introduction to Wilder’s Type on TD Ameritrade
- 2 What Is a Wilder’s Moving Average?
- 3 How Does Wilder’s Type Work on TD Ameritrade?
- 4 Why Use Wilder’s Type in Your Trading Strategy?
- 5 Differences Between Wilder’s Moving Average and Other Moving Averages
- 6 Trading Strategies Using Wilder’s Moving Average
- 7 Real-Life Example of Wilder’s Type on TD Ameritrade
- 8 FAQs
- 9 Conclusion
Introduction to Wilder’s Type on TD Ameritrade
Wilder’s Moving Average, developed by J. Welles Wilder Jr., is a variant of the more commonly used moving averages like the Simple Moving Average (SMA) and the Exponential Moving Average (EMA). What sets Wilder’s Moving Average apart is its specific calculation method, which makes it highly responsive to price changes while still providing a smoothed representation of market trends.
On TD Ameritrade, a popular trading platform in the USA, Wilder’s type is integrated into technical analysis tools that help traders make informed decisions. If you’re an active trader or just starting in technical analysis, understanding what a Wilder’s type moving average is and how it functions on TD Ameritrade can elevate your trading approach.
In this article, we’ll explore:
- What is a Wilder’s Moving Average?
- How does Wilder’s type work on TD Ameritrade?
- Why use Wilder’s type in your trading strategy?
- Differences between Wilder’s Moving Average and other moving averages
- Real-life trading examples
- Frequently Asked Questions (FAQs)
Let’s dive in!
What Is a Wilder’s Moving Average?
Wilder’s Moving Average is a type of smoothed moving average that is less reactive to short-term fluctuations and better captures long-term trends. Developed by J. Welles Wilder Jr. (the same person who created the famous Relative Strength Index, or RSI), it is widely used in technical analysis for smoothing price data and identifying the direction of market trends.
Unlike the Simple Moving Average (SMA), which gives equal weight to all past data points in the period, and the Exponential Moving Average (EMA), which gives more weight to recent prices, Wilder’s Moving Average smooths data using a different formula that incorporates more of the past data. This results in a slower-moving average that is less susceptible to short-term price noise but still responsive enough to catch significant trends.
How Wilder’s Moving Average Is Calculated
The formula for Wilder’s Moving Average is:
[
\text{Wilder’s MA} = \frac{( \text{Previous Wilder’s MA} \times (n – 1)) + \text{Current Price}}{n}
]
Where:
- Wilder’s MA = the current period’s moving average
- n = the number of periods chosen for the moving average
- Current Price = the most recent closing price
The key difference in Wilder’s formula is that it uses the previous moving average value in each new calculation, making it a cumulative average that becomes smoother as more data points are included.
This characteristic makes Wilder’s Moving Average slower to respond to sudden price changes, but its smoothing effect helps traders focus on the overall trend rather than short-term volatility.
How Does Wilder’s Type Work on TD Ameritrade?
On TD Ameritrade, the term “Wilder’s type” is specifically used when discussing moving averages in their thinkorswim platform. Thinkorswim, TD Ameritrade’s advanced trading platform, provides various moving averages, including Wilder’s type, as part of its technical analysis toolkit.
Using Wilder’s Type in thinkorswim
Here’s how you can apply Wilder’s type moving average on TD Ameritrade’s thinkorswim platform:
- Open the thinkorswim platform.
- Navigate to the Charts section.
- Select the stock or asset you want to analyze.
- In the top menu, click on Studies and then select Edit Studies.
- In the search bar, type “Moving Average” and select Wilder’s Moving Average.
- Set the period for the moving average based on your strategy (common periods include 14, 50, or 200 days).
- Apply the study to your chart.
The Wilder’s type moving average will now appear on your chart as a smoothed line that follows the general direction of the asset’s price. This moving average can be used in conjunction with other technical indicators, such as the Relative Strength Index (RSI) or Average True Range (ATR), both of which were also created by Wilder.
Interpreting Wilder’s Moving Average on TD Ameritrade
Like other moving averages, Wilder’s type is used to determine trend direction and momentum. If the price is above the moving average, it may suggest an uptrend, and if it is below, it could indicate a downtrend.
Wilder’s type can also be used to generate buy and sell signals. For example:
- Buy Signal: When the price crosses above the Wilder’s Moving Average, it may signal the start of an uptrend, and traders could consider entering a long position.
- Sell Signal: When the price crosses below the Wilder’s Moving Average, it may signal the beginning of a downtrend, and traders might consider selling or shorting the asset.
Why Use Wilder’s Type in Your Trading Strategy?
1. Better for Long-Term Trends
Wilder’s type moving average is less prone to whipsaws (false signals caused by short-term fluctuations), which makes it ideal for traders focusing on long-term trends. Its smoothing effect can help eliminate short-term market noise, giving you a clearer picture of the underlying trend.
2. Complementary to Other Wilder’s Indicators
Since Wilder’s type is part of a broader suite of indicators developed by Welles Wilder Jr., it can be especially powerful when used alongside other indicators like the Relative Strength Index (RSI), Average True Range (ATR), and Directional Movement Index (DMI). Many traders use Wilder’s type with the RSI to get a comprehensive view of market momentum and trend direction.
3. Minimizes the Impact of Price Volatility
One of the key advantages of using Wilder’s type on TD Ameritrade is its ability to minimize the impact of price volatility. If you’re trading highly volatile assets, such as cryptocurrencies or tech stocks, Wilder’s type can help smooth out sharp price movements and allow you to focus on the overall trend.
4. Customization and Flexibility
TD Ameritrade’s thinkorswim platform allows you to customize the period of the Wilder’s Moving Average to suit your trading style. Whether you’re a short-term trader looking for quick trends or a long-term investor aiming for stable returns, you can tailor Wilder’s type to fit your strategy.
Differences Between Wilder’s Moving Average and Other Moving Averages
While there are several types of moving averages available for technical analysis, here’s how Wilder’s Moving Average compares with the most commonly used ones:
Wilder’s Moving Average vs. Simple Moving Average (SMA)
- Simple Moving Average (SMA) gives equal weight to all data points in the period, making it more sensitive to recent price fluctuations.
- Wilder’s Moving Average, on the other hand, gives more weight to older data, resulting in a smoother line that’s less reactive to short-term noise.
Wilder’s Moving Average vs. Exponential Moving Average (EMA)
- Exponential Moving Average (EMA) reacts more quickly to price changes because it gives greater weight to more recent prices.
- Wilder’s Moving Average is slower to react but better captures the long-term trend without being overly sensitive to price spikes.
Wilder’s Moving Average vs. Weighted Moving Average (WMA)
- Weighted Moving Average (WMA) assigns weights to data points, with the most recent data receiving the highest weight. It is typically faster and more reactive than Wilder’s Moving Average.
- Wilder’s Moving Average spreads the weighting more evenly across the data points, offering more consistent smoothing.
Trading Strategies Using Wilder’s Moving Average
Wilder’s Moving Average can be a key component in several trading strategies. Below are a few approaches where Wilder’s type could be particularly useful:
1. Trend Following
Wilder’s type excels in trend-following strategies. Traders look for price movements above or below the moving average as entry and exit points. For example:
- Buy when the price crosses above the Wilder’s Moving Average.
- Sell when the price crosses below the Wilder’s Moving Average.
2. Using Wilder’s Type with RSI
Since both Wilder’s Moving Average and the Relative Strength Index (RSI) were developed by the same person, they work well together. The RSI is used to measure the strength of price movements, and when combined with Wilder’s Moving Average, it can give traders a powerful tool for identifying overbought or oversold conditions in relation to the prevailing trend.
3. Moving Average Crossover Strategy
A popular strategy using Wilder’s type is the moving average crossover. This strategy involves using two different moving averages—typically a short-term Wilder’s Moving Average and a longer-term one. When the shorter moving average crosses above the longer moving average, it signals a buy. Conversely, when the shorter moving average crosses below the longer one, it signals a sell.
Real-Life Example of Wilder’s Type on TD Ameritrade
Let’s take a real-world example of using Wilder’s type in a trading scenario on TD Ameritrade.
Imagine you are analyzing Apple Inc. (AAPL) stock. After applying the 14-period Wilder’s Moving Average on the thinkorswim platform, you notice that the price crosses above the moving average. This signals a potential uptrend, and you decide to enter a long position.
Next, you use the RSI to confirm whether the stock is overbought or oversold. Since the RSI is below 70 (not overbought), you confirm that the uptrend has momentum. Over the next few weeks, Apple’s stock continues to rise, and the price remains above the Wilder’s Moving Average, validating your decision to hold the position.
After several months, the price crosses below the Wilder’s Moving Average, signaling the end of the uptrend. You decide to exit the position, locking in your profits.
FAQs
1. What is the difference between Wilder’s Moving Average and EMA?
Wilder’s Moving Average and EMA both assign more weight to recent data, but Wilder’s formula uses a cumulative approach that smooths out the data more gradually than the faster-reacting EMA.
2. Can I use Wilder’s Moving Average with other technical indicators?
Yes, Wilder’s Moving Average works well with other indicators like RSI, ATR, and DMI, allowing for a comprehensive analysis of market trends and momentum.
3. What is the best period for Wilder’s Moving Average?
The best period depends on your trading strategy. Short-term traders may prefer a 14-period Wilder’s Moving Average, while long-term investors often use 50- or 200-period averages to capture broader trends.
4. Does Wilder’s type work on all asset classes?
Yes, Wilder’s type can be applied to stocks, commodities, cryptocurrencies, and other asset classes on TD Ameritrade.
Conclusion
Wilder’s type on TD Ameritrade is a powerful tool for traders looking to smooth out price data and focus on long-term trends. Its ability to minimize short-term volatility while capturing significant market movements makes it ideal for trend-following strategies. Whether you’re using it alone or in combination with other indicators like RSI, understanding how to utilize Wilder’s type moving average can significantly improve your trading performance.
Now that you know “what is a Wilder’s type on TD Ameritrade” and how it works, it’s time to apply this knowledge to your trading strategy and start seeing better results!


+ There are no comments
Add yours